Experimental web page
My platform for web development!
Finds out the web technologies about performance timing, resource timing, performance timing marks and web page optimization. Also tests out new experimental technology for improving my web pages function and performance. And learn and get familiar with new standards / technologies, before I implement them one my web pages. Experimental web code.
Time and data metrics shown below are live from this very web page!
The metrics below is for evaluating which metrics to track for web analytics in the future. To be able to analyze the performance of my website. Such as timing diagrams for critical loading metrics, for cases as landing page without cached resources, landing page with cached resources and the web pages surfed to from them. Three different cases interesting to study!
It is also a way to learn how browsers handled resource loading and caching of web pages, in relation to how they are coded, and about the rendering path of the web page.
Testing some font sizes for the body text:
|XX Font Size 20px XX||XX Normal Font Size XX||XX Font Size 18px XX||XX Large Size XX|
Input: Your Body Text Is Too Small
Explores Performance Timing
Explores performance and navigation timing considering how it can be used for data tracking of the web pages. To be able to understand how my web pages work, to see what performance improvements I make and to see which things influenses the web performance, like hardware and downlink speed as well as the critical rendering path.
The differens of local client time and server time:
JS Diff time: Client - Server: ?
JS difference Local time - UTC/GMT: ? (s)
JS difference Local time - Europe/Berlin: ? (s)
Php difference EuBerlin - UTC/GMT time: 7200 (s)
Php Date RequestStart Europe/Berlin: 2026-04-25, 14:03:09.504
N.B. Server time stamps:
Different metods getting server time stamps:
REQUEST_TIME_FLOAT: 1777118589.50452
Php-Script begin: 1777118589.505738
gettimeofday(true): 1777118589.538141
microtime(true): 1777118589.538143
Php-script server timing:
Server Time To Load Php-Script: 1.2 (ms)
Server processing time web page code: ?
N.B. Client time stamps:
Some key performance timing:
JS Ping, Round Trip Time (RTT): ?
JS Navigation request start: ?
JS Time To First Byte (TTFB): ?
The difference between Client - Server navigation (request) time start timestamps:
JS Diff time: Client - Server: ?
Loading Block timing of the web page:
PerformanceTiming - Navigation Timing API
JS Time unload previous web page: ?
JS ∑ Time make connection: ?
JS App cache load time:
JS DNS Lookup time:
JS SSL handshake time:
JS Request response time: ?
JS Html document load time: ?
JS DOM rendering time: ?
Loading & Parsing timing of the web page:
Navigation Timings graph
JS Navigation start:
JS Navigation fetch start: ?
JS App Cache loaded: ?
JS DNS Lookup done: ?
JS SSL Done / Connect End: ?
JS Navigation request start: ?
JS Navigation response start: ?
JS DOM Loading start:
JS First-paint: ?
JS Time First-Contentful-Paint (TFCP): ?
JS DOM Time To Interactive (TTI): ?
JS DOM Loaded & Parsed Event: ?
JS DOM Rendered: ?
JS Page Load-Event: ?
JS Page Load-time: ? - loadEventEnd
JS Page Fully loaded: ? - last resource responseEnd or loadEventEnd
JS First client interaction: ?
Marked Bold are DOM rendering events that can be used with the addEventListener() Method for control of the Critical rendering path.
HTTP Archive: Loading Speed metrics, Web historical statistical data as references.
Rendering path timing of the web page:
Time marks measured by performance.mark():
Php script server side begin: ?
PhpTrackIT server side begin: ?
PhpTrackIT server side end: ?
Php script server side end: ?
JS Head Tag web page begin: ?
JS Head CSS <link>-prelod: ?
JS PhpTrackIT client side begin: ?
JS navigator.sendBeacon Queued: ?
JS Head CSS <link>-stylesheet begin: ?
JS Head CSS <link>-stylesheet parsed: ?
JS Body: Main Pane web page begin: ?
JS Footer Text web page begin:
JS Navigation bar web page begin:
JS Menu Pane web page begin: ?
JS Footer bar web page begin:
JS JavaScript Section end body begin: ?
JS Body Tag web page end: ?
JS PhpTrackIT JSimg preload begin: ?
JS PhpTrackIT JSimg preload loaded: ?
JS PhpTrackIT JSimg preload duration: ?
JS Time to set a performance.mark(): ?
JS Resource Timing (delayed +ms): duration (responseEnd)
(Only CSS, beacon, fetch & my JSimg resources are displayed.)
( TotalTime = Sum of all time spent in parallell downloads.)
?
More Events one can use to controle the critical rendering path:
(Interactive = DOM Interactive, Complete = DOM Rendered)
JS addEventListener-readystatechange: ?
JS document.onreadystatechange: ?
Web Analytics:
The Speed Index at WebPagetest is interesting but sadly hard to measure by own code.
The 10 Must-Track Web Performance Metrics. Site Speed Tips for Performance Nerds.
Site Speed Metrics Explained - TTFB, Speed Index, Interactive, Load, Complete, and more.
If You´re Not Lazy Loading Your Images, You´re Being Wasteful.
Lozad.js: Performant Lazy Loading of Images , Lozad.js , Lozad.js
The
window.location.reload(true) doesn´t clear the cache as it should, on some browsers!But the
sessionStorage.clear() works well.I have tried the Clear-Site-Data header, which should clear browsing data (cookies, storage, cache), but with no success. Haven´t found any way to always via code clear the cached data.
Some more to read and test: Clearing cache in the browser.
Explores the navigator object data, for which data is suitable to track as a resource for the web development, and which data could be used to adapt det resource loading of the website.
It´s still (Mars 2019) a somewhat experimental data not available on all webbrowsers and not fully interpreted the same. But still, it now provides useful information to collect for better understanding of the use and the prerequisites for the computer surfing of visitors.
By having it on this web page one can check this data on the mobile in different location and observe how it influences the data. I start in that way, before I decide which data to track.
For the moment the Chrome webbrowser has most of the navigator objects data of browsers.
Navigator Object info:
JS Connection: ?
JS DownlinkMax: ?
JS Do Not Track: ?
JS send.Beacon: ?
JS localStorage: ?
JS Touch event: 0
Browser plugins installed:
Explores Pointer accuracy
Primary Pointer accuracy:
Any Pointer accuracy:
Primary Pointer can hover:
Any Pointer can hover:
Max Touch Points:
Touch Action: 0
Has PointerEvent: 0
Use this data for "Client Diveces used" categorization in: MobilePhone / LapDesktop / TouchLandscape / TouchPortrait / PointerCoarseLandscape / PointerCoarsePortrait statistics.
Memory used: 1686 kbytes
Memory used: 2048 kbytes
Memory peak used: 1726 kbytes
Memory peak used: 2048 kbytes
Testing different methods for browser size:
document.body.offsetHeight: ?
document.body.clientHeight: ?
document.body.offsetWidth: ?
document.body.clientWidth: ?
document.body.parentElement.offsetHeight: ?
document.body.parentElement.clientHeight: ?
document.body.parentElement.offsetWidth: ?
document.body.parentElement.clientWidth: ?
window.innerHeight: ?
window.innerWidth: ?
window.outerHeight: ?
window.outerWidth: ?
document.documentElement.clientHeight: ?
document.documentElement.offsetHeight: ?
document.documentElement.clientWidth: ?
document.documentElement.offsetWidth: ?
Is JavaScript OK: ?
Retrives a temp value string from temperatur.nu, by php file_get_contents():
To make my own async JavaScript using document.getElementById("demo").innerHTML
Test: return (temperature)value via Fetch API:
The temperatur data is cached (1) in client sessionStorage and (2) on web server, for 600s. Thus lowering the load at
 temperatur.nu.
Hide / show a menu by moving it out of the browser window
- Menu Item 13
- Menu Item 14
- Menu Item 15
- Menu Item 16
- Menu Item 17
- Menu Item 18
- Menu Item 19
- Menu Test
With vertical-align middle.
Table based Navigation bar test:
vertical-align:middle; height:calc(100% - 4px);
Below is the start page content of autonomtech, to have as reference when testing.
Web development tools
 Link Library:
A link library of useful quality links within web coding:
- Code References
- Test, Verify & Optimize
- Coding Hints, Tips & Help
- Blogs & Security
- IDE, Integrated Development Environment
- Free Resources
- Code Frameworks & Libraries
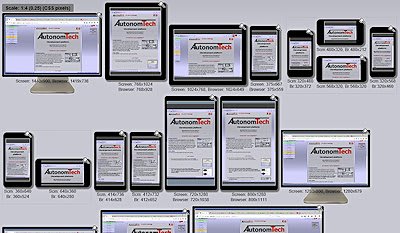 Responsisualizer, device screen simulator:
Free tool to use.
- A responsive web page multi-device screen simulator.
Visualizes a web page in 18 different screen resolutions simultaneously, in live functional simulated device views. - Views pages in real world restricted browser viewports.
- Magnifies a device screen to scale 1:1 in lightbox mode.
- Uses 18 popular browser viewports from real world tracked visitor data!
- Useful both for a check of the responsive action and for verify the design layout of the web page at different screen sizes.
Live Demos
-
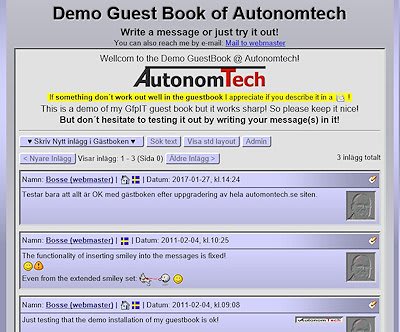 Guest Book: A captcha free, user friendly and robot spam safe guestbook! You can try it out and see a demo of it here.
(And write a message to me, if you want :-) or just test it!)
With emoticons gallery, where one can add more own emoticons. -
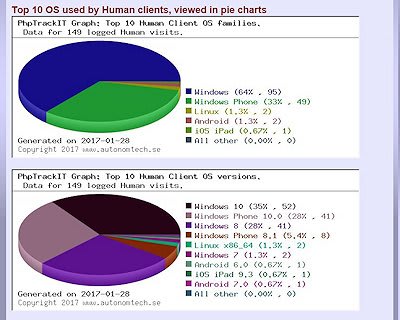 PhpTrackIT visit logger - explore my demo of it, tracking this site!
Distinguish between Human and Robot visits, with high accuracy!
Focuses on visualising trends of numerous visits! Gives facts and figures of your visitors logged tracks on your website!
Shows statistics details of the hardware used at the client sida.
Is an efficient tool for evaluating and visualizing the website.
N.B. In the PhpTrackIT demo is not all tracked details displyed when not logged in, because I care about some privacy aspects of my website! -
 Responsisualizer: A responsive web page multi-unit screen simulator. Visualizes a web page in 18 different screen resolutions simultaneously. View your web pages in real world restricted browser viewports. Free tool to use.
-
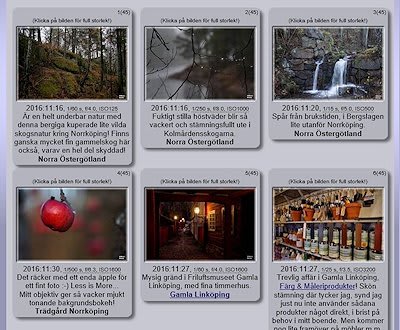 PhpGallery: A photo gallery script.
Automatically crop photos to thumbnails and large photos, and creates image text files. Also creates an index file of the photos display order and the page pagination.
View thumbnails in a gallery style layout, with small captions to the photos, clickable into larger photo in lightbox mode.
For the moment I code:
- A Guest Book script called Guest FootPrint IT - GfpIT Guest Book.
- An advanced visit tracking software - PhpTrackIT.
- A responsive web multi-screen simulator - Responsisualizer.
- A photo gallery script - PhpGallery.
- My "Sinunomous" Web Platform, which I use for this site. From Sinus & Autonomous.
Which all are planned to be released as free open source software in the future.
Technical links
Current operational situation of electricity in Scandinavia - Map: Production & consumption
